We had the opportunity of trying out some new tech a while back when building a licence system and going through the options for persisting data we ended up choosing Event Store (not just for the cute mascot). It’s not really intuitive to get up and running but works well once there. However, now about three months in production with only about a few thousand events stored the server went down. A quick look in told me space was out (we’re running on a free AWS instance) and I had my suspicouns. First, check the log files, no problem there but then looking at the chunk files for Event Store we found our offender, with only a few thousand events of our own the Event Store flat files was taking up 4.5gb, whaat?
This shouldn’t frighten anyone really, it’s not a lot of data and really not affecting the performance of the Event Store I think but for our tiny instance space was out and we had to get to the bottom of it.
Turns out there’s a system stream called $stats-127.0.0.1:2113 generating events for tracking the server state. How often this happens is configurable but I think the default is every 30 sec. Over the course of a couple of months this becomes, yes, that’s right, a whole lot 🙂
So we’re stuck with a few million events of a considerable size that we really don’t need or ever want to make use of. What to do? The answer isn’t entirely straight forward and I couldn’t find an explanation anywhere but after piecing together a few different bits of information this is what I got to:
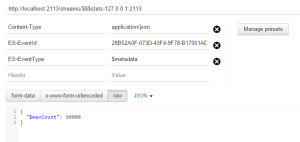
Post an event to update the $maxCount metadata on the $stats stream and trigger a scavenge to remove the old events and merge the chunks.
This seems straightforward but I had some issues even getting there, like, how do I post the event? How do I scavenge? In the end of course, knowing how to do it, it’s not that tricky.
Since the prod environment was all out of space I used WinSCP to connect with an auth key to the AWS instance and downloaded the data files, easily setting up the Event Store server locally.
I posted the event using the HTTP API through the Chrome add-in Postman:
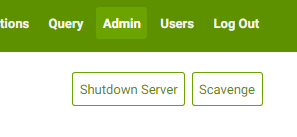
And the scavenge is triggered easily enough by pressing this little button under the Admin tab in the web interface:
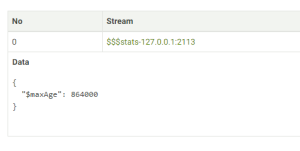
You’ll see in the Event Store output how it goes through the chunks and how much space was saved. If you open the stream through the stream browser you can press the metadata button to get the metadata stream and inspect the current settings:


Thank you. That helped us with avoiding the same problem in future. It should be noted that you have to url-encode the stream-name when using curl for it. Here’s the corresponding curl statement:
uuid=$(uuidgen)
curl -i http://127.0.0.1:2113/streams/%24%24%24stats-127.0.0.1%3A2113 –user admin:changeit -H “Content-Type: application/json” -H “ES-EventId: $uuid” -H ‘ES-EventType: $metadata’ -X POST -d ‘{“$maxCount”:100}’
And you can check if it worked with:
curl -i http://127.0.0.1:2113/streams/%24stats-127.0.0.1%3A2113/metadata –user admin:changeit
Awesome, and thanks for the snippet. We ended up doing a curl script like that nightly and putting it in a cron job to continuously cut down the log.