What is this?
I got the chance to try out NDepend, although with everything else, it took me quite some time until I finally got around to picking it up. Now NDepend is a tool, both command line, stand alone and as an addin to Visual Studio which allows you to do static analysis and reporting on your .Net projects. It uses a Linq based paradigm to build rules around the code metadata it reads from the solution making it incredibly versatile in terms of extending and customizing. In this blog post I’ll take you through my initial 2-3h user journey in trying out the tool.
Installation
After writing a few installers myself using both the old fashion visual studio included tools and lately using Wix I can appreciate that the NDepend team didn’t waste time trying to do this. NDepend simply comes as a zip file which contents you drop in a folder, completely fine and it’s a one line instruction on what you need to do, “unpack and run xxx”. I installed it to %programfiles% as per the instruction though you will get prompted with a UAC, which is stated on the web page, it’s just something you need to live with. It still makes sense to put it there rather than anywhere else so I’m fine with that. However, running the visual studio extension installer wouldn’t work unless I right clicked and ran it as an administrator, no biggie just worth mentioning.
New NDepend project

Now, this may for you as for me be a bit tricky. We’ve got quite a big code base by now and most of the projects don’t compile individually but congregate into one output folder for the entire application. No worries though, just choose “Add assemblies in folder” and pick your choice from the output folder. Now obviously, this means you’ll have to choose the Debug/Release folder if doing different build configurations which you’re likely to be doing however if you’re using this in CI you can redirect to the right one and if you’re doing it in Visual Studio it ought to be easy enough to switch to the right one and rebuild when you want to inspect the solution with NDepend. I also had to modify the default paths but it was quick and easy.
How to analyse
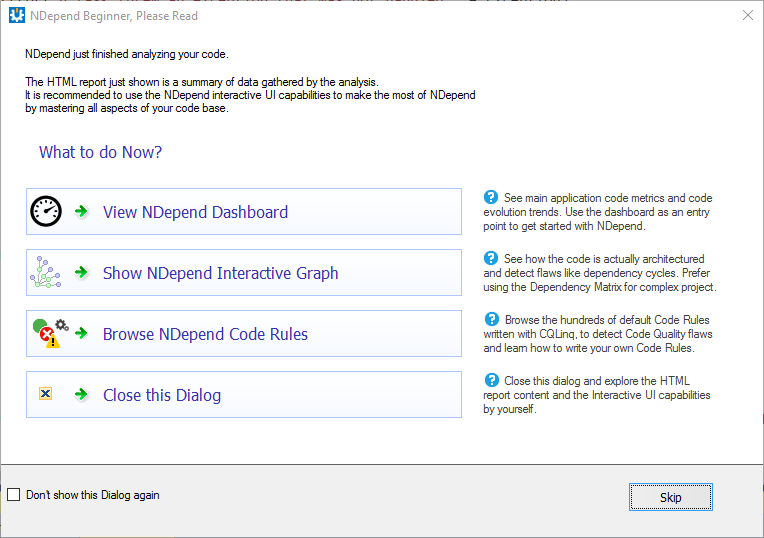
Good question, I went for the recommended dashboard view as I’m trying this out and want to see what it has to offer.
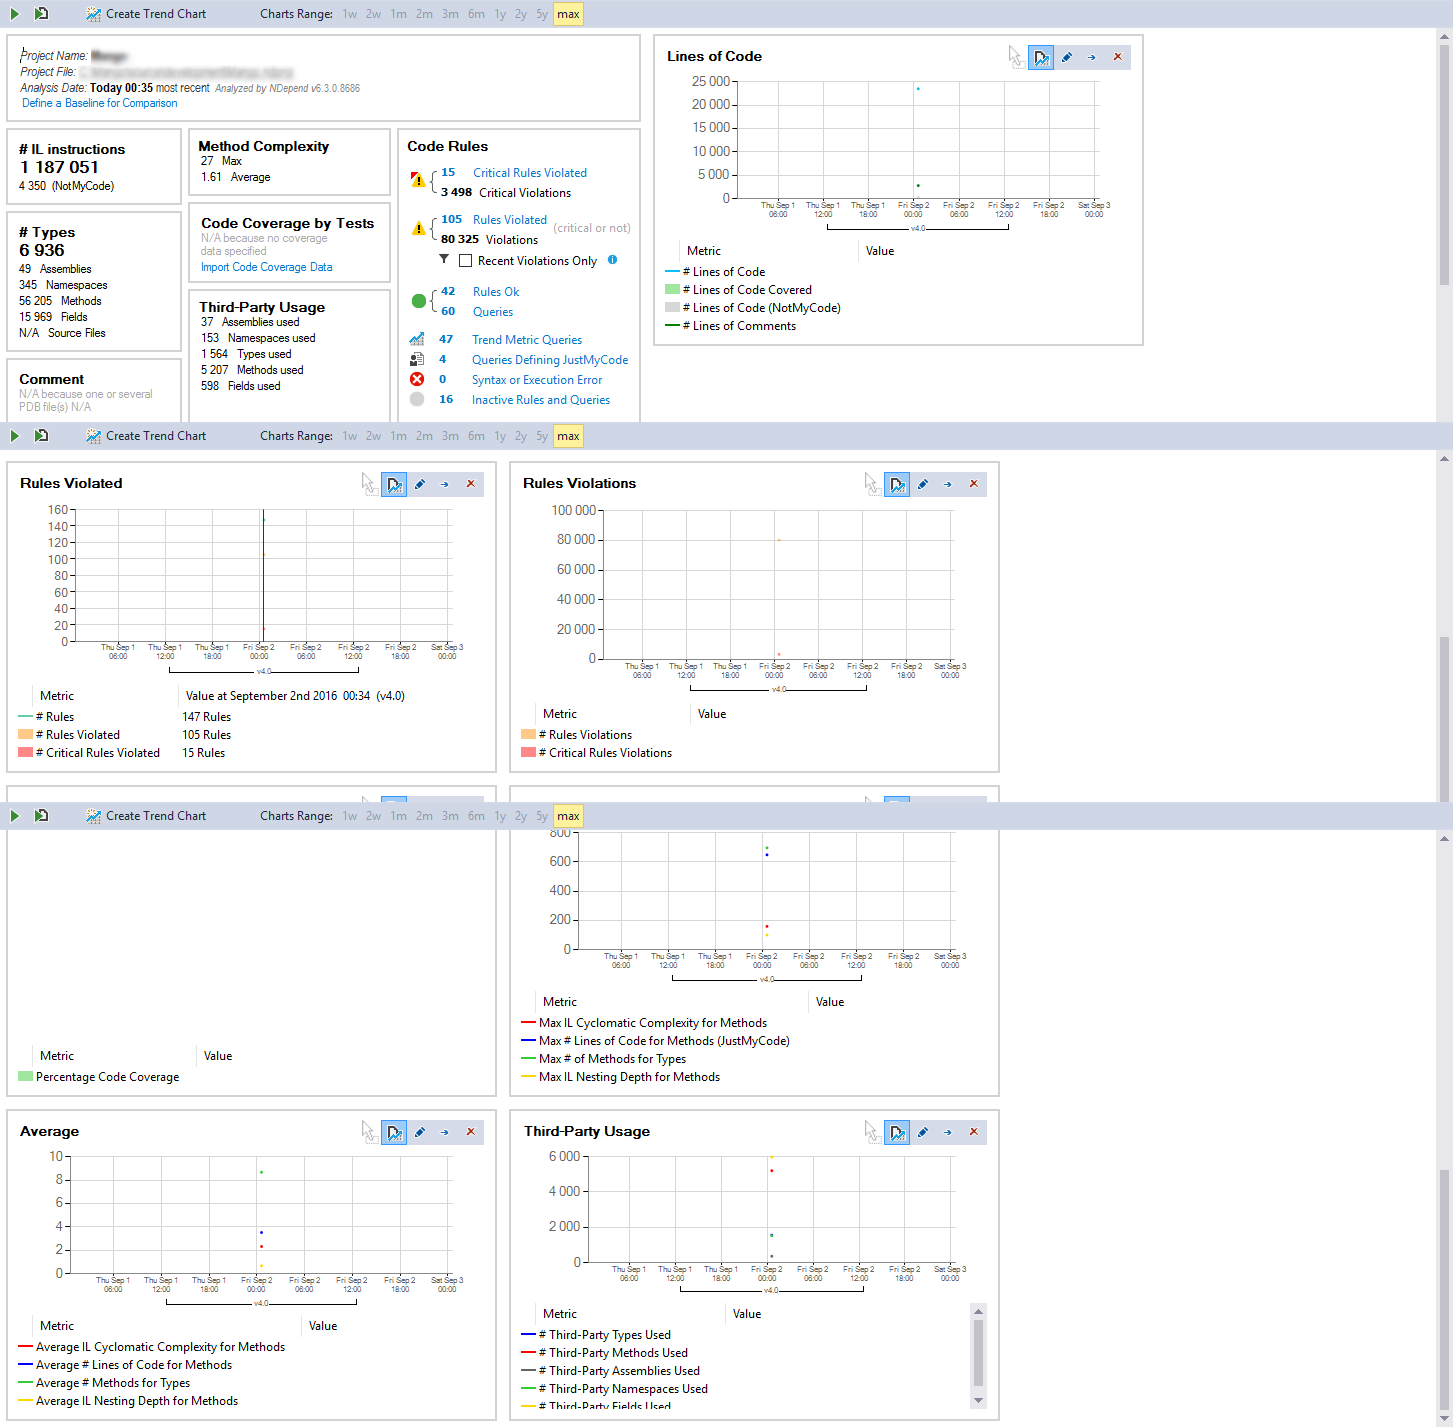
The report
Code coverage
This bit is empty for now which makes sense as I’ve yet to give it any code coverage report to work with and if it could statically figure out what coverage I’ve got without even running the tests now that would be magic. I quickly found a button to import this though.

But alas! Of the three supported coverage formats, NCover, DotCover and Visual Studio Coverage I’m not using any.

Like many others out there, I’m sure, we’ve got a tight budget and have been busy with other things to get the business to pay us for one of these tools. What we use instead is OpenCover, a great open source alternative. I’ll have to delve into possibly being able to convert the OpenCover reports to one of the above formats and importing it to NDepend.
Looking closer at the code coverage docs there are a few more options like TestDriver.net and using VSPerfMon as well. Both might cost you though. You might be able to use VSPerfMon for generating the coverage output but to be able to create a readable xml coverage report you’ll still be dependent on the coverage analysis dlls shipped with the enterprise version of visual studio. TestDriver.net comes free for open source projects as far as I could see.
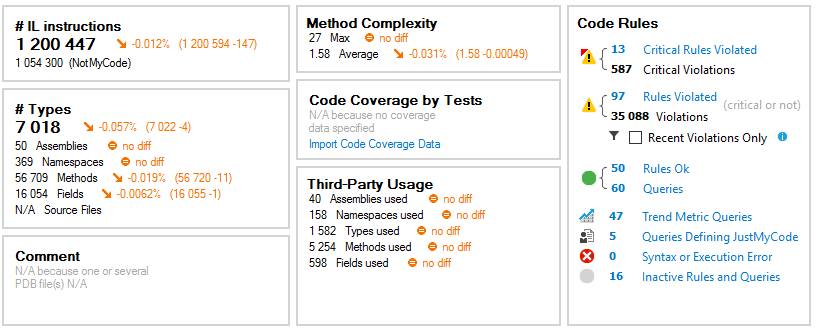
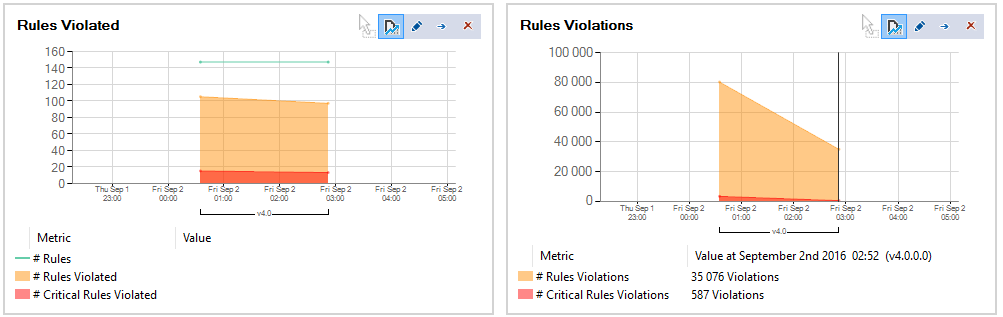
Critical Rules Violated
Sounds dangerous however I’m happy there’s a way to find out 🙂 Looking at the code rules section, the first time around got me wondering, why are there two values? Opening it reveals that the first value highlights unique rules broken and the 2nd value the the total number of violations. We have a lot of them unfortunately. Seems we’ve got a bit of late spring cleaning to do.

Drilling down on the rules seems easy enough as they’re all highlighted in a good manner and clicking each of these items I’m surprised at how fast it displays the results.

Also, I’m happy to see it’s not just our libraries that are at fault here (apologies to ServiceStack et al :P)
Now this tells me I should exclude 3rd party libraries to not skew my stats, after all, I’m not much interested in violations in code I don’t directly control.
Re-defining justmycode
Now the linq feature of NDepend is really neat and the way it comes with intellisense works great. I figured I could, instead of messing around with the settings of which assemblies to analyse, try to adjust the selection by changing one of the linq queries. There’s a set of queries limiting the rule validation called justmycode. You can access these by clicking the “Queries Defining JustMyCode” in the result box which will bring you to:
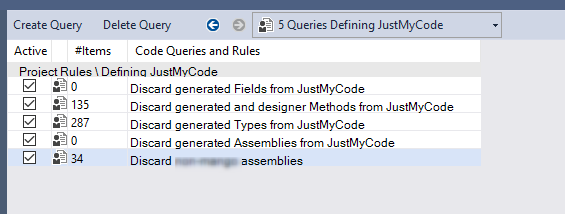
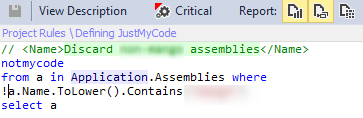
This was a little backwards because the queries collects and tags assemblies as notmycode, the negative of justmycode. That’s fine though, I just had to invert my linq selection query, saved it and reran and now I get the analysis only on my assemblies.
Modifying the query was a good exercise however in the end I went with removing the 3rd party libraries from the instrumentation all together anyway since they still showed up in the total numbers. The justmycode only made them get grayed out as I drilled down which is good in a way but not entirely what I wanted. Might be there are other ways of configuring this as well.
Understanding the issues
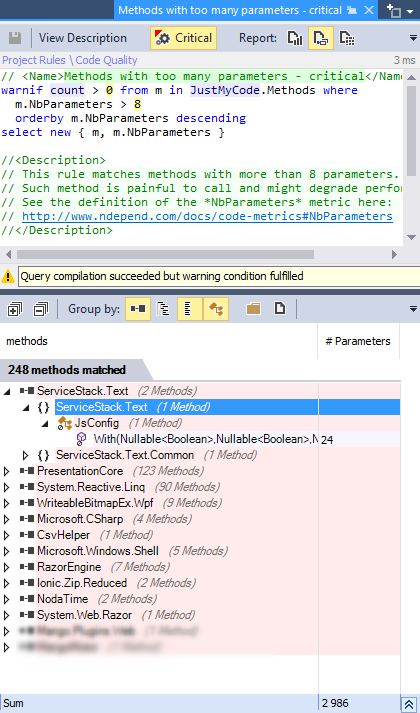
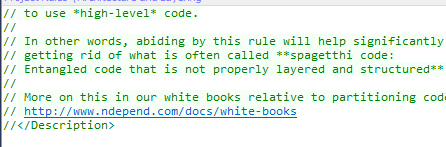
Now that we got a list of errors we can start fixing them. Some of the rules are pretty straightforward while others might come across as obscure. Good thing is though, if you open the rule editor you get a nicely commented script of how it’s detected and what it actually means with a reference to the documentation:
Reporting on progress
I ran my analysis first thing when I opened NDepend and got the dashboard view nicely and neatly enough however when I wanted to see things get better as I solved issues it was a little harder. For starters, though having rerun the analysis several times, I still only had one logged output in all the graphs. Trying to activate the comparison mode didn’t improve the situation, i deleted some types and solved some rule violations however the stats looked the same:

Now being careful with rebuilding my project between analyses I got a diff in the end, the graphs were still single value though.
There is also an option to always compare against the previous report which maybe ought to be default.
Consulting the documentation, which seems is very helpful and well covered without being huge, I found that it’s not strange I’m not getting any graphs since historic logging is turned off by default, a little odd maybe since the default view shows so many historic graphs.

Now that didn’t get me the trends I wanted, I also needed to reconfigure how often these are logged in the following setting:
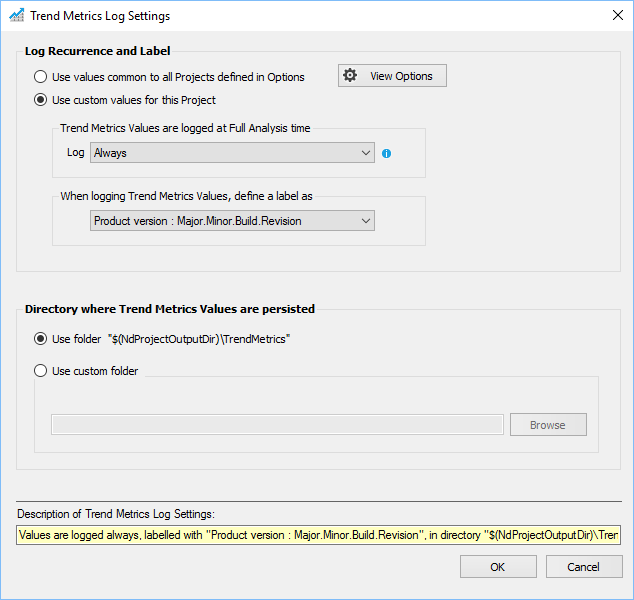
After this I got neatly printed logs for each analyze I triggered.
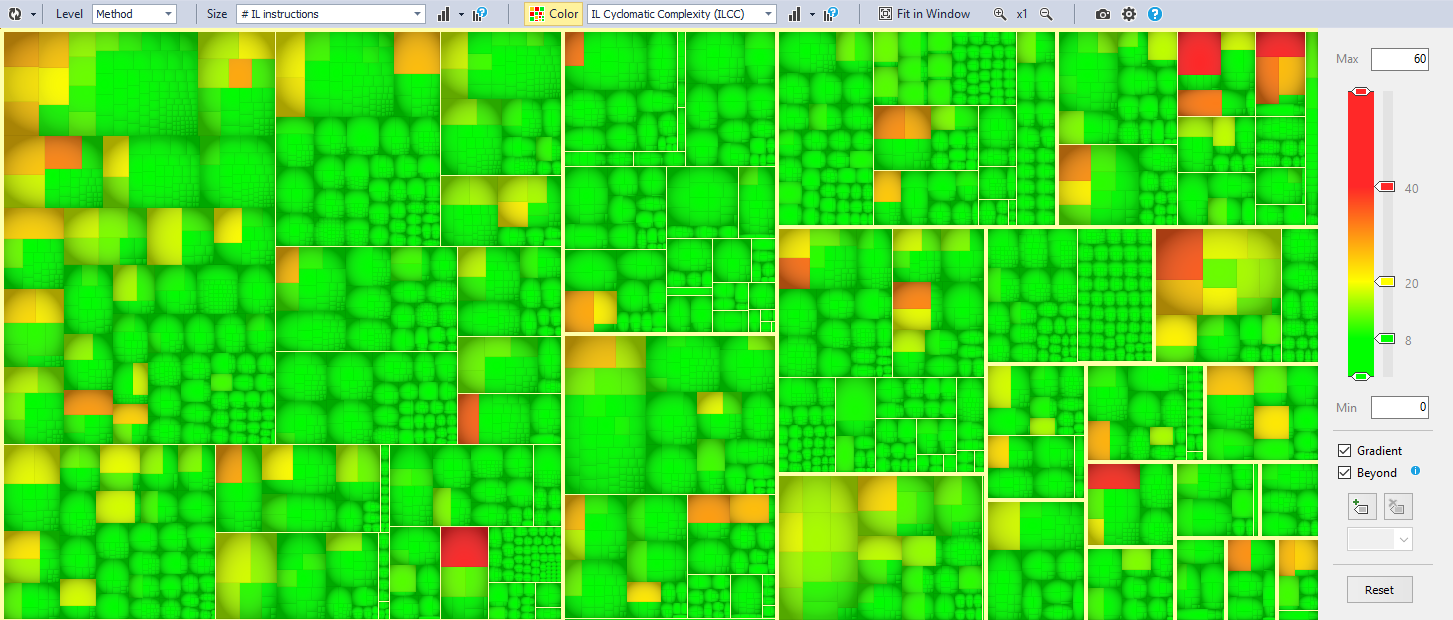
Code metrics
Code rule validations is one good way to assess the quality of the code, code metrics is another. The Visual Studio addin comes with a great heat map tool to identify issues with code metrics based on some prescribed recommendations from NDepend. Here I can easily spot some methods in my code that has far too many lines for example:
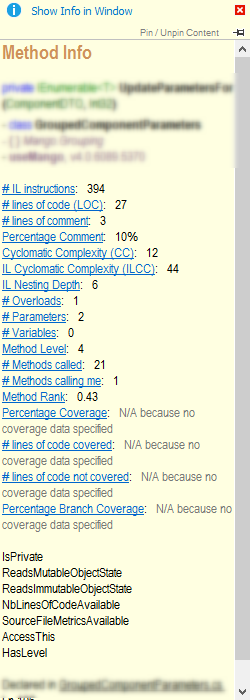
When hovering the method I get full details about its metrics and where and what method it is:
Wrapping up
Aside from these major features NDepend comes bundled with a huge numbers of easily accessible metric filters and other things. Now I only played around with it for 2-3 hours and locally on my machine so I can’t say yet how it performs ‘in production’ so to speak. All in all, it seems like an incredibly versatile and robust tool. Being used to the JetBrains Resharper (don’t get me wrong, I love it) and Visual Studio analysis tools I’m very surprised with how well this one performs both in terms of the interactive reporting tools and the analysis itself. It just runs very smoothly.
I will try to make another post when I get this running with our CI as I believe no instrumentation is only truly powerful when combined with trends, it’s like velocity, having 16% commented code is fine but what you really want to see is that it improves or at least doesn’t drop. So, I’ll get back to you when I’ve had a chance to try this a bit more over time.
A big thank you to the NDepend team for urging me to play around with this, I hope I can find time to use it more up ahead.