Firebase Analytics is an incredibly powerful tool to understand how users use your mobile or web app. The past year I have been using it to draw insights and help prioritise and improve various functions in our team.
Firebase Analytics is mostly good for collecting data, to get any real insights, you need to ask the right questions. I do this using BigQuery and Metabase. I have written more about Metabase in a separate article.
This post is meant to be more of a living document, a book of recipes for how to do different things with BigQuery and Firebase analytics specifically. I hope it can serve you as it does me.
Types of queries
- Events week-by-week
- Events by user
- Comparing average order prices per platform
- Segmenting analytics based on Firebase AB test variants
- Measuring retention
- Recent weeks
Events week-by-week
Getting week by week is really good for generating graphs and Week-over-Week measurements.
As an example, here is a graph comparing application users with users viewing items weekly:
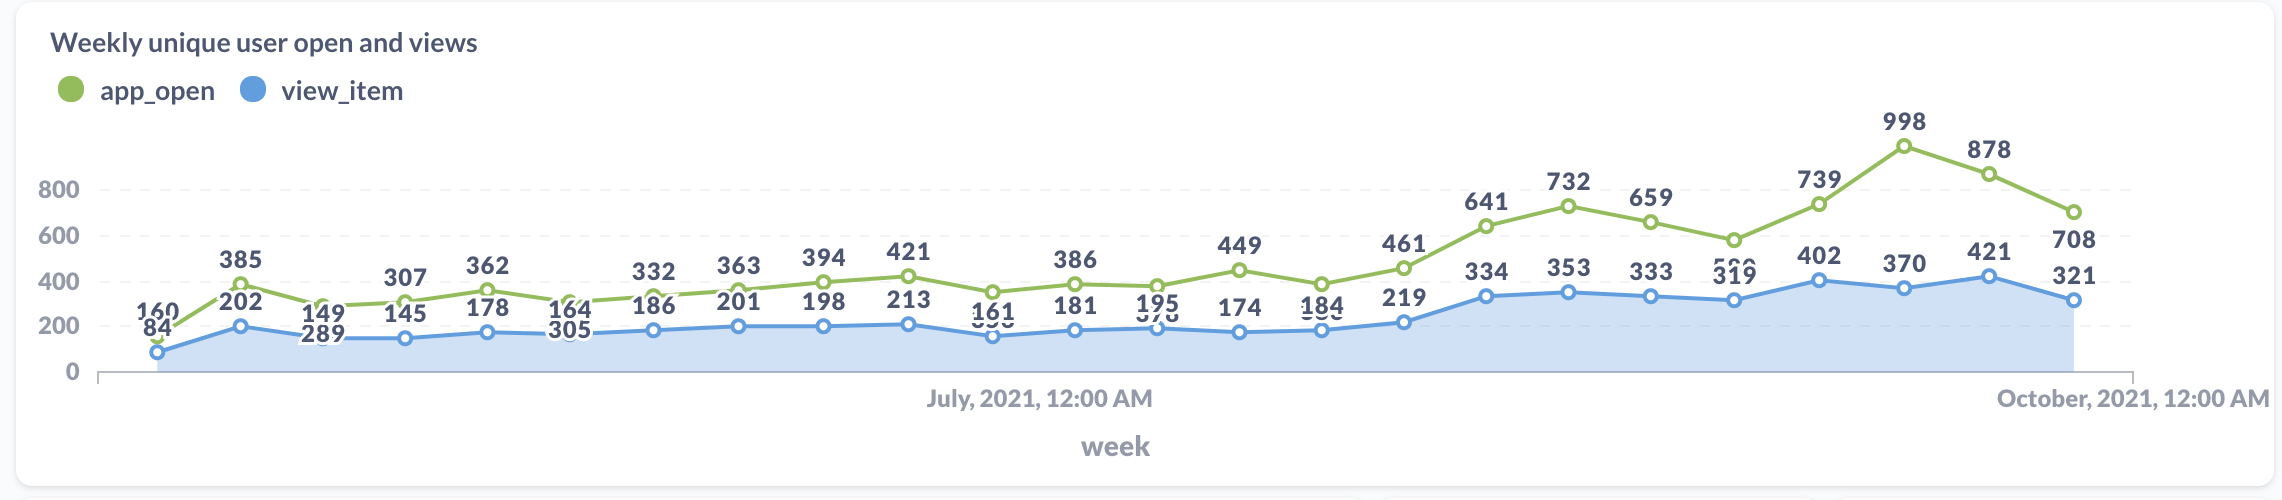
Example of users and item view events week-over-week
In this script, we are converting the timestamp of the Google Analytics event to a datetime. The datetime is truncated using date_trunc and week() with a weekday to change which day the week starts with. This way we can define a week as something else than Mon-Sun which can be helpful as sometimes, it can take a day or two to get data from Firebase for example, into Google Analytics.
Specifically, we wanted to check the data on Mondays which meant that measuring data from Sun-Sat made sure the weekly data had all been logged properly before we drilled into it.
The data from this specific query can look something like this:
| platform | week_start | unique_users |
| ANDROID | Saturday June 26th | 236 |
| IOS | Saturday June 26th | 103 |
| IOS | Saturday July 3rd | 303 |
| ANDROID | Saturday July 3rd | 256 |
Weekly grouped data by truncating event_timestamp with WEEK(SATURDAY)
Events by user
Many times it’s worth calculating how many events each user does. Usually, this is a type of engagement measure. For a service like Netflix, it would be many many episodes or movies a user on average watches per given period.
It can help track trends in usage or, by applying segmentation, the easiest, as in this case, the platform. In the example below, I’m checking how many times on average a user does a search, using a custom event. This is useful and can be used to show, like in the graph below, how the activity is different between app types.
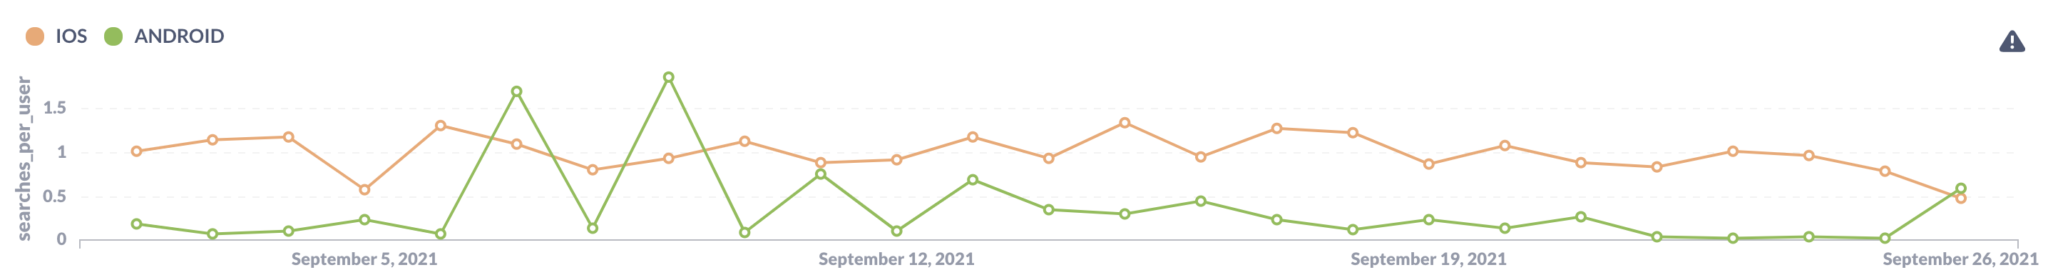
Example of showing the average number of search events per unique users
Comparing average order prices per platform
The Google Analytics view_item event comes with a whole load of different properties out-of-the-box and you can always add more to there if you want. Here I show how to get out the average value and how many unique views total we have for items.
Segmenting analytics based on Firebase AB test variants
Firebase AB testing allows for really neat built-in segmentation of users and then drilling down on the success of these tests by comparing selected conversion events.
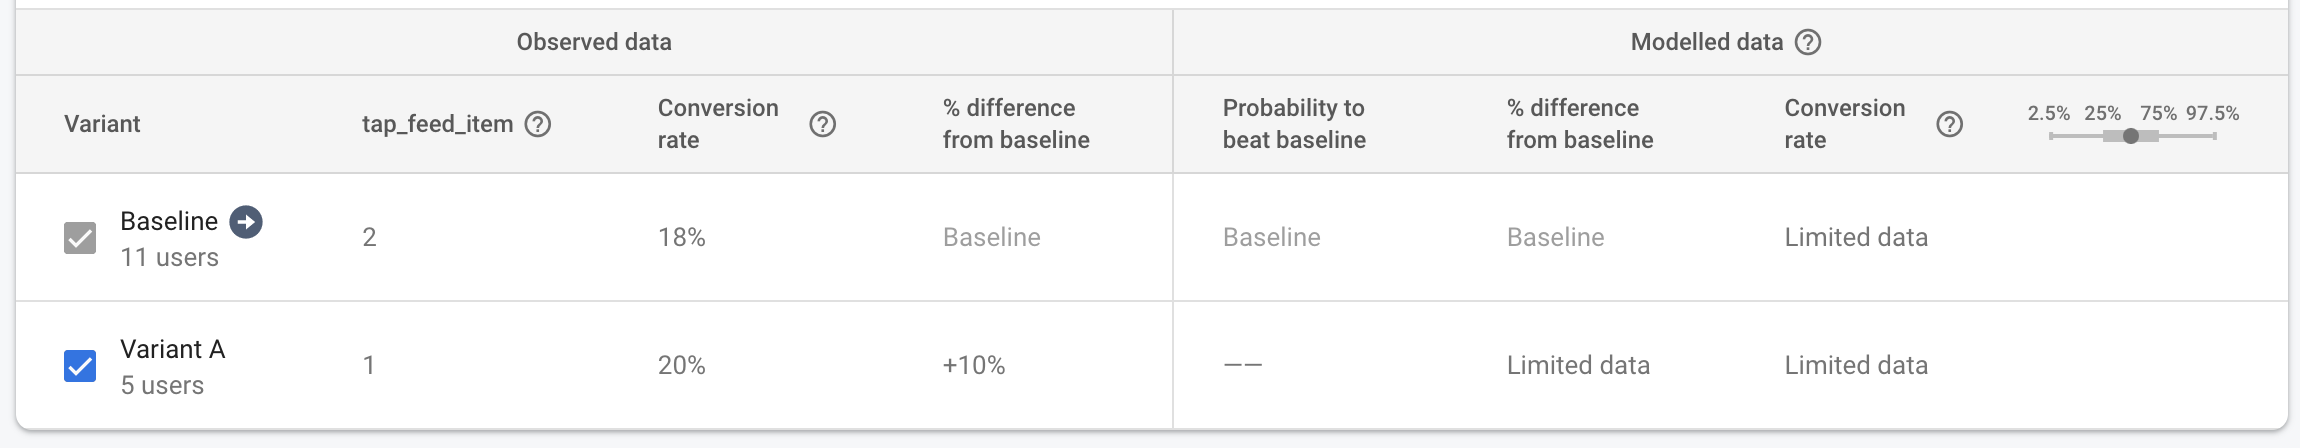
Example of Firebase AB test conversion event comparison
However, the built in Firebase dashboard only compares unique user events and won’t allow you to measure for example how many times users in either variant of the tests did a certain action (unless you measure conversion events).
I have not been able to find any official documentation on how to do this but digging into the logged analytics I found that Firebase sets user properties that we can use to segment the data. The final query looks like this:
For a deeper dive into this, read my medium article on how to segment Firebase AB test users.
Measuring retention
There is an old marketing/sales saying that it costs many times more to acquire a new user than to retain existing customers. Our users in modern apps are no different, not to mention that a lost user seldom comes back and the market is saturated. A user lost is a user someone else will be able to server.
For this reason keeping an eye on retention is important. Firebase has some built in retention stats but I feel they don’t really show the real image of how long your core users stay with you. I have also found that some measuring app_open events, for example, may not truly signify that users are staying active.
Here is an example of how I have instead measured retention in my app using a breakdown of when a user last watched an article in my app and comparing it with when they first did so, measuring the interval as their total retention time.
This graph can then give you a quick breakdown month-by-month of how long your core users have stuck around.
Graph of each month’s retention number, how many users has been retained for how long. Displayed in Metabase
Recent weeks
When tracking your app usage, monthly goals are better than daily or weekly because throughout a week, there is just too much fluctuation. However, as you move from week to week you will likely want to add extra effort and course correct if you see your weekly numbers dropping.
Here is how I track weekly app opens, getting just the past few weeks:
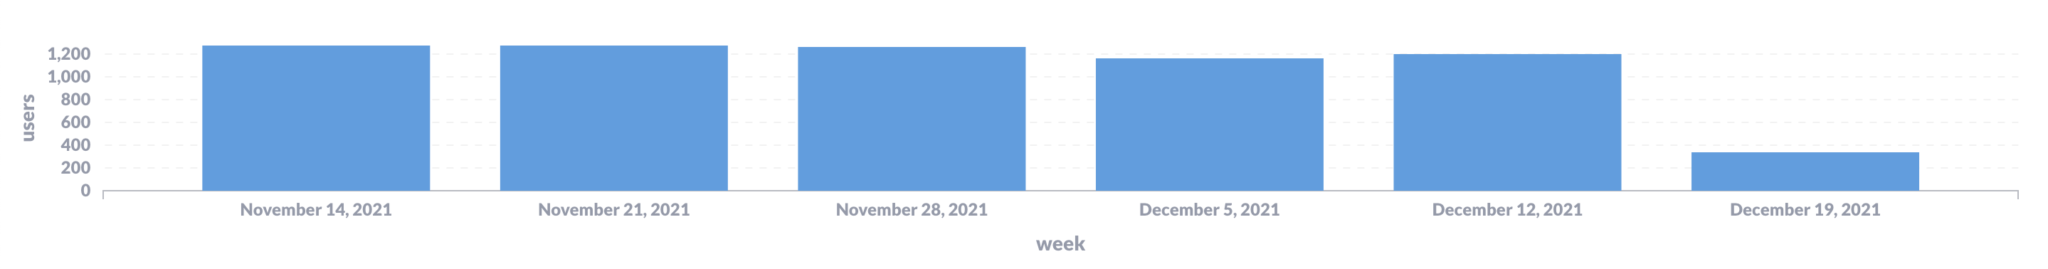
Metabase view of past six weeks of app opens
I use the DATE_SUB function here to get a date several weeks back.
Partition data properly
In the examples above I filter data based on the parsed event date. This works perfectly fine but, it means you will read far much more data than needed if you know what dates you are looking for.
As the Firebase event data is partitioned by date, you can instead filter out only the tables you need to scan for events using the _TABLE_SUFFIX. This will save you time and memory for each query, in the following example, I count recent events for the past week: